By Tiffany Andry, Christophe Hurter, Francois Lambotte, Pierre Fastrez and Alexandru Telea (2020)
Abstract : Infographics range from minimalism that aims to convey the raw data to elaborately decorated, or embellished, graphics that aim to engage readers by telling a story. Several studies have shown evidence to the negative, but also positive, effects on embellishments. We conducted a set of experiments to gauge more precisely how embellishments affect how people relate to infographics and make sense of the conveyed story. By analyzing questionnaires, interviews, and eye-tracking data simplified by trail bundling, we show that, within certain bounds, embellishments have a positive effect on how users get engaged in understanding an infographic, with very limited downside. To our knowledge, our work is the first that fuses the aforementioned three information sources to understand infographics. Our findings can help to design more fine-grained studies to quantify the effects of embellishments and also to design infographics which effectively use the positive aspects identified for embellishments.
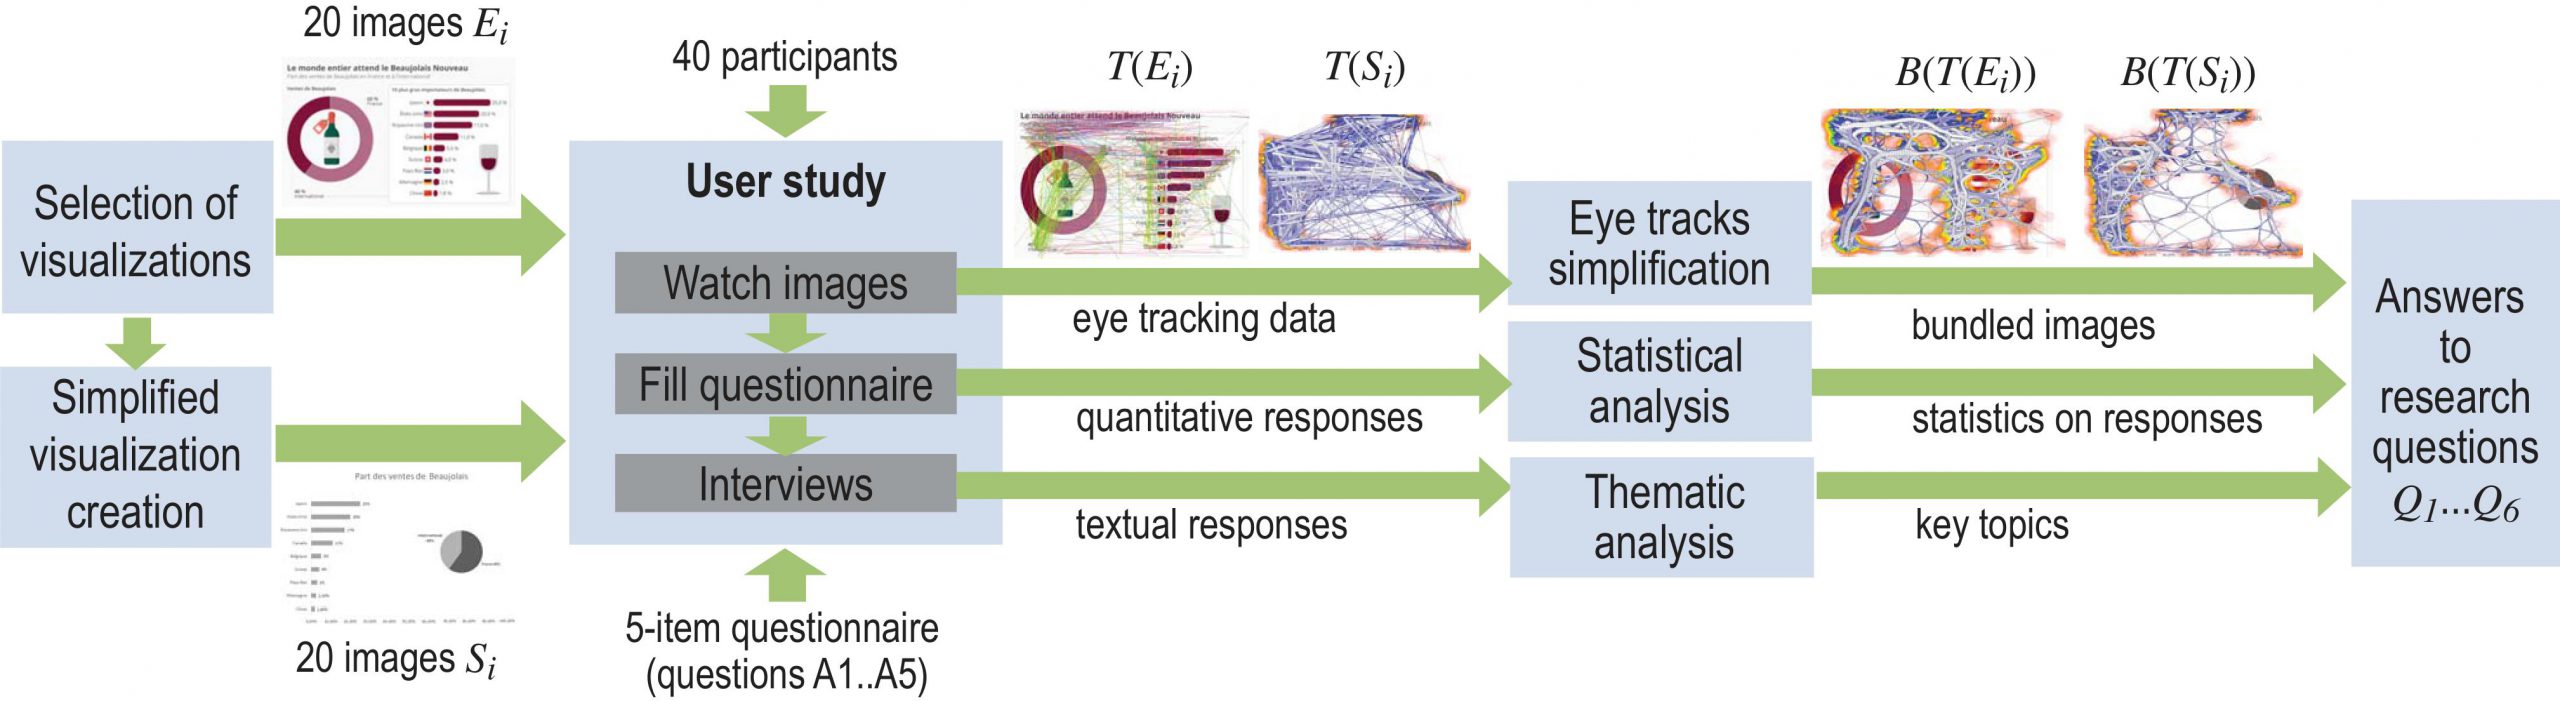
Pipeline of conducted user experiments and subsequent data analysis
This experimentation has led to the generation of 4 types of data, as follow.
This zip file contains two types of data :
- Data visualizations (images) used in the study in .png format. The images n°1 to 19 are embellished visualizations; the images n°21 to 39 are the corresponding standardized visualizations.
- The eye tracking data related to these images. These .csv files present the gaze data of all the users for one image. Thus, the .csv file n°1 naturally corresponds to image n°1. It presents the gaze data of 20 users according to the experimental protocol. Each .csv file is a sequence of screen (x,y) coordinates which represent the extracted fixation points.
Self reported appreciations data
This excel file presents the self reported appreciations data collected during the experiments, for 39 participants. The "Stats" sheet presents the participants' answers. The "Answers" sheet explains the code assigned to the answers and the "Embellished or Standardized" sheet indicates the nature of the visualizations tested during the experiment.
Semi structured interviews verbatims, per image
This excel file contains the verbatims of all participants, listed by view. The participants are anonymized. It is therefore qualitative and textual data.
This website presents the result of the bundling on all the images of the corpus.
Remarks :
- Data are in French
- The data visualization tested in this expermient have an ID. You can find this ID in "Images and gaze data" file, where the images file name correspond to visualizations ID.
- We considered data visualisations 1..19 as embellished and data visualizations 21..39 as standardized.
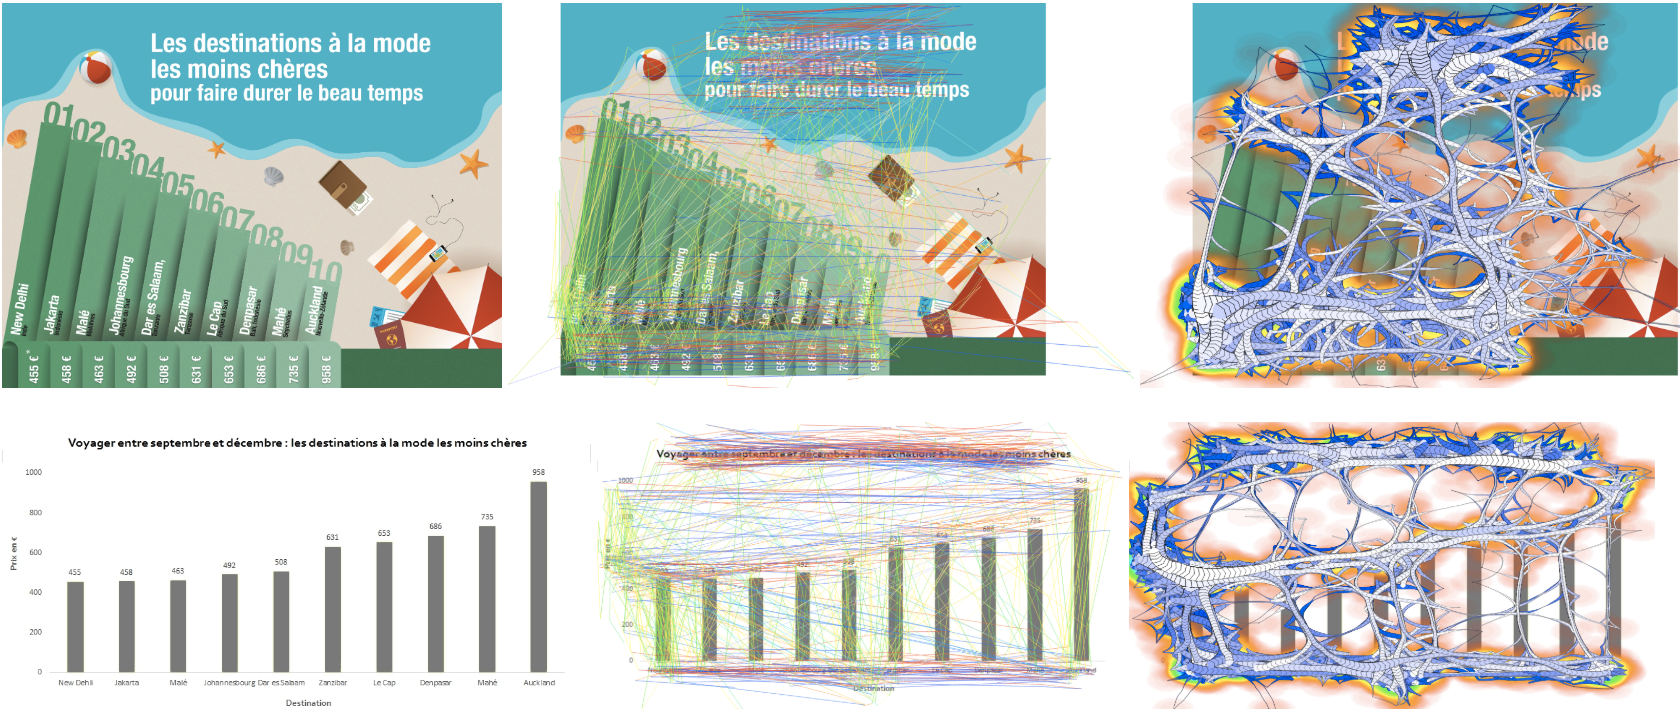
This image shows the gaze data bundling. On the first line, we see the original image, followed by the different gaze plots available and then the bundling for all users. The first line concerns the embellished visualization n°1, and the second line concerns the standardized visualization n°21, which corresponds to it.